Introducing EZShapes®
EZShapes quickly empowers you to create any shapefile to effectively represent your data. A simple web interface provides all you need to create the custom shapes that will make your data come alive.
Powerful
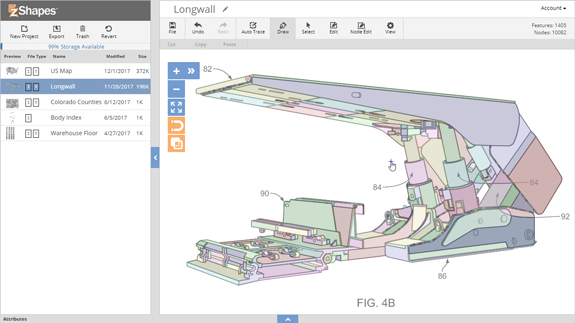
Fast, accurate, and simple raster-to-polygon scanning algorithms can convert many complex drawings with a single click.
- Edit data elements on a new or existing shapefile
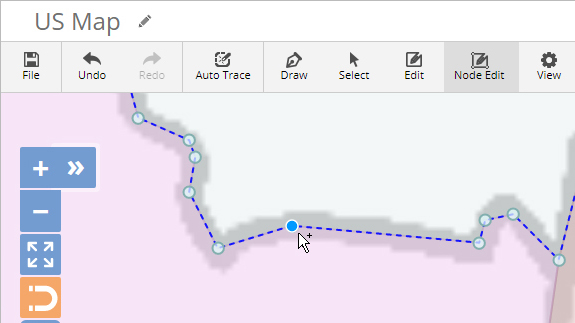
- Edit graphics using operations such as node edits, slice, subtract, merge, and simplify
Versatile
Create shapefiles by tracing a raster drawing such as a JPG, PNG, GIF, or BMP file.
- Loads and modifies industry-standard shapefiles
- Helps turn your line art and maps into shapefiles
- Create shapefiles from scratch
Convenient
Exported shapefiles can be used as Choropleth maps with DAS.
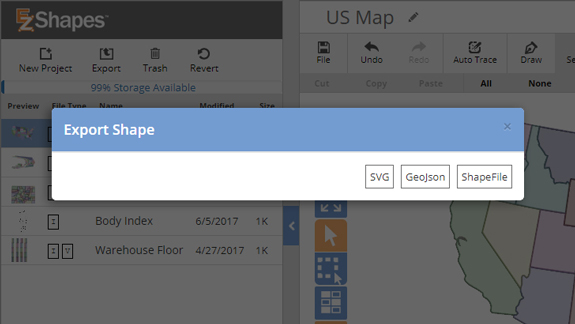
- Export results as shapefiles, GeoJSON, or SVG file formats
- Map-base filtering makes your reports easier to produce and more professional

EZShapes is part of ReportsNow, which also includes DAS8™, mobie®, and all our other amazing solutions. It’s everything you need to let end users create brilliant, real-time reports and dashboards with JD Edwards data.
 Copyright © 2017 - 2026